

Has France any military assets to spare for the Pacific?
If so, how?


Has France any military assets to spare for the Pacific?
If so, how?

Influence is not achieved only by the deployment of military assets... still, I haven't seen much evidence that the French are trying to build influence in the neighborhood, would be interested in the sources behind the claim.
The whole aim of practical politics is to keep the populace alarmed (and hence clamorous to be led to safety) by menacing it with an endless series of hobgoblins, all of them imaginary
H.L. Mencken

Ray's source is the first I have seen in regard to the Pacific. I had just been noticing in recent months a variety of sources in regard to the recent rise of how residents of the Middle East perceived France as compared to other Western powers.
Here is one source, a youth survey in the Middle East in 2012
http://www.arabyouthsurvey.com/engli...12_English.pdf
"ARAB YOUTH SEE FRANCE
MOST FAVOURABLY
AMONG ALL FOREIGN
COUNTRIES; VIEWS OF
CHINA AND INDIA ARE
ALSO INCREASINGLY
POSITIVE
One year after the start of the
Arab Spring, young people in the
Middle East have changed some
of their views of major foreign
powers, and now look more
favourably upon France, China
and India"
Robert C. Jones
Intellectus Supra Scientia
(Understanding is more important than Knowledge)
"The modern COIN mindset is when one arrogantly goes to some foreign land and attempts to make those who live there a lesser version of one's self. The FID mindset is when one humbly goes to some foreign land and seeks first to understand, and then to help in some small way for those who live there to be the best version of their own self." Colonel Robert C. Jones, US Army Special Forces (Retired)
Of course a French Defence Minister on a tour of Asia will make brave noises about commitment to the region, but I have to wonder if those noises are being backed up by any sort of action.
The whole aim of practical politics is to keep the populace alarmed (and hence clamorous to be led to safety) by menacing it with an endless series of hobgoblins, all of them imaginary
H.L. Mencken

If you dont read the newspaper, you are uninformed; if you do read the newspaper, you are misinformed. Mark Twain (attributed)
French military Strategy
http://www.cfr.org/france/french-mil...gration/p16619
French Foreign, Defense, And National Security Policy: New Initiatives?
http://www.stimson.org/spotlight/fre...w-initiatives/

Quick plausibility check:
http://www.census.gov/foreign-trade/balance/c5700.html
"2012 : U.S. trade in goods with China"
"TOTAL 2012 (...) 127,032.0" (imports, million USD)
in 4 months, so roughly 380 billion in a year.
U.S. production of goods (this goes beyond consumption just as the trade statistic):
https://www.bea.gov/iTable/iTableHTML.cfm?reqID=5
"Gross Output by Industry Billions of dollars"
"All industries" "2010"(last available, dunno why) "25811.4"
(Note: U.S. definition of "industries" isn't actually about resource production and manufacturing only!)
Quick check using the gross figures instead of value added:
380/25811.4*100% = approx. 1.5%
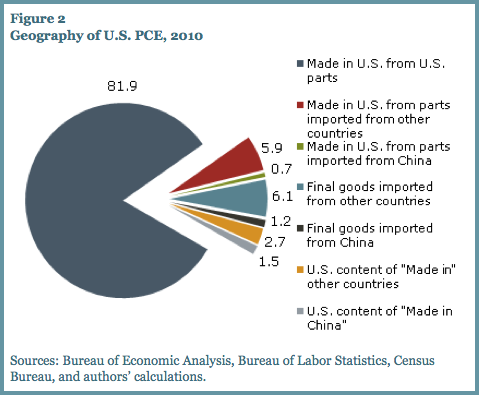
So this is probably approx. where they got the pie chart's 1.2+0.7% from.
It looks to be at about the same order of magnitude as the 1.2+0.7% of the pie chart.
This was about gross output. Total GDP of the U.S. is only about 15.1 trillion, though -and only about 20% of it is primary+secondary sector. Obviously, gross output is a poor base for such calculations as it's bigger than the GDP!
Now let's look at value added:
https://www.bea.gov/iTable/iTableHTML.cfm?reqID=5 (direct links don't seem to work well there)
"Agriculture, forestry, fishing, and hunting"
"Mining
"Utilities"
"Construction"
"Manufacturing"
(these are as far as I can tell the true goods-producing sectors)
"Value Added by Industry Billions of dollars"
year: "2011"
"177.8"
"287.6"
"250.8"
"520.3"
"1837.0"
sum: 3037
Now let's have fun and compare the 380 billion with the 3037 billion:
380/3037*100% = approx. 12.5%
I call the pie chart B.S.
(I love it when I make a 15 minute plausibility check and it's not in vain!)
Whoever compiled that chart was either incompetent, did at least one mistake less than me and/or meant to produce wrong propaganda.
After all, the share of Chinese goods in consumables is likely larger than smaller in comparison to its share in regard to investment goods.
It’s a graphic in an article published via the Federal Reserve Bank of San Francisco. As to whether the authors [1, 2] are culpable on any of those three counts, I suspect…Originally Posted by Fuchs

that the issue might be one of operational definitions. Perhaps that you are not reading <content> as per the authors’ usage? From the article:
Of the 2.7% of U.S. consumer purchases going to goods labeled “Made in China,” only 1.2% actually represents China-produced content. If we take into account imported intermediate goods, about 13.9% of U.S. consumer spending is attributable to imports, including 1.9% imported from China.
Last edited by ganulv; 06-25-2012 at 06:35 PM.
If you dont read the newspaper, you are uninformed; if you do read the newspaper, you are misinformed. Mark Twain (attributed)

Winning friends and influencing people via the Armee de l'Air.
"We fight, get beat, rise, and fight again." Gen. Nathanael Greene
 Posting Permissions

Bookmarks